New – graphical representation of salary deductions
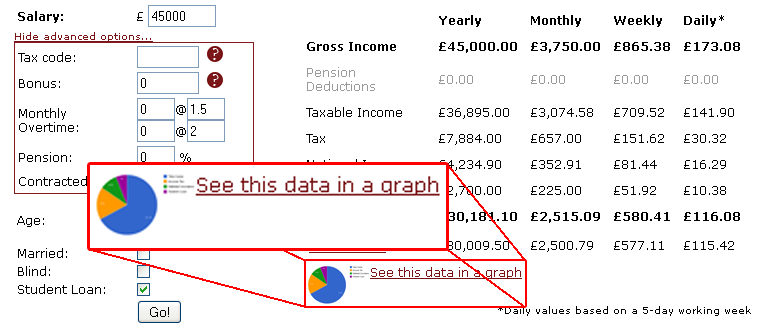
To help you to visualise where your income deductions are going, and how much of your money you get to keep (take-home pay), I thought I would add some pie charts to The Salary Calculator. Now, when you have entered your details and are viewing the table of results, there is an option to see a graphical representation of that information:
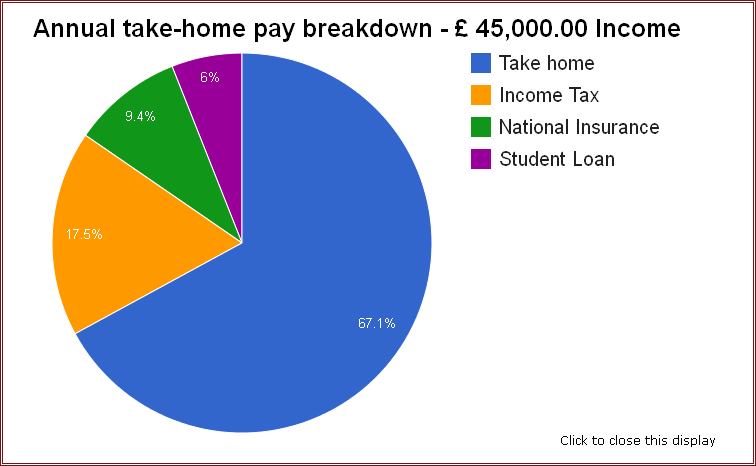
Click on this link, and an overlay will pop up, to show you an interactive pie chart that clearly explains where your money goes each year:
Of course, it will also show pension and student loan deductions if those apply to your calculations. To get started, head over to The Salary Calculator and enter your details. I hope you find this new tool useful – please use the comments section below to leave any feedback or suggestions for improvements.
None of the content on this website, including blog posts, comments, or responses to user comments, is offered as financial advice. Figures used are for illustrative purposes only.
Visualisation of salary deductions
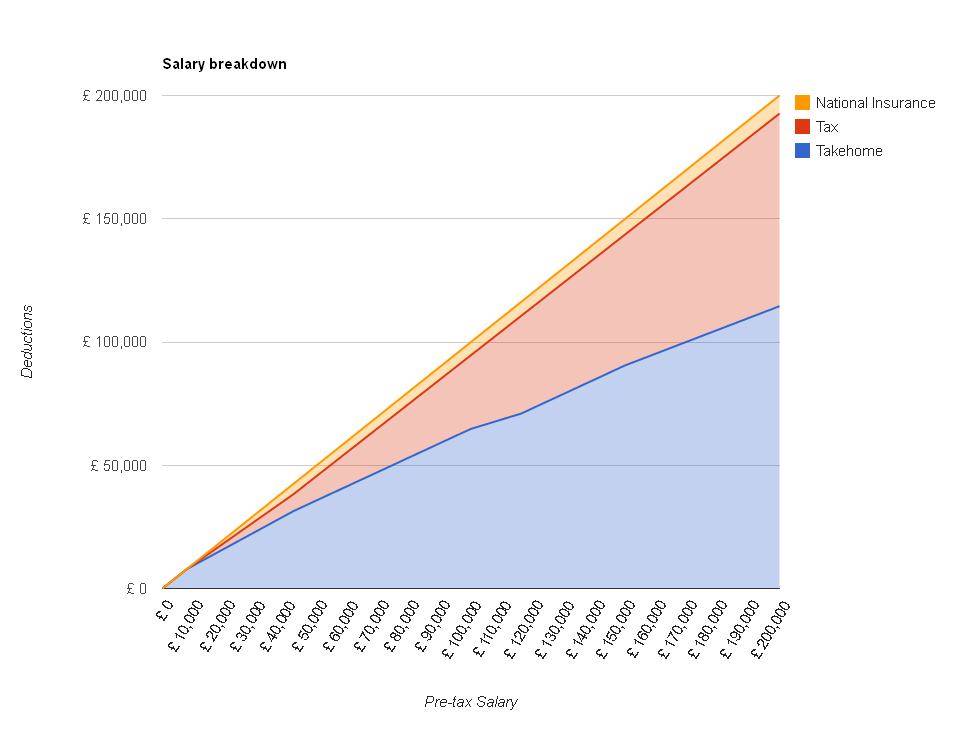
Following the update of The Salary Calculator to April 2012 tax rates, I thought it might be interesting to see how the proportion of your salary eaten up by income tax and National Insurance changes as you earn more money. If you earn less than £8,105 you pay no tax and less than £7,605 you pay no National Insurance. But those earning more than £150,000 per year will be losing nearly half their income to the tax man. I created the following chart showing how your take-home pay increases as your salary increases from £0 to £200,000:
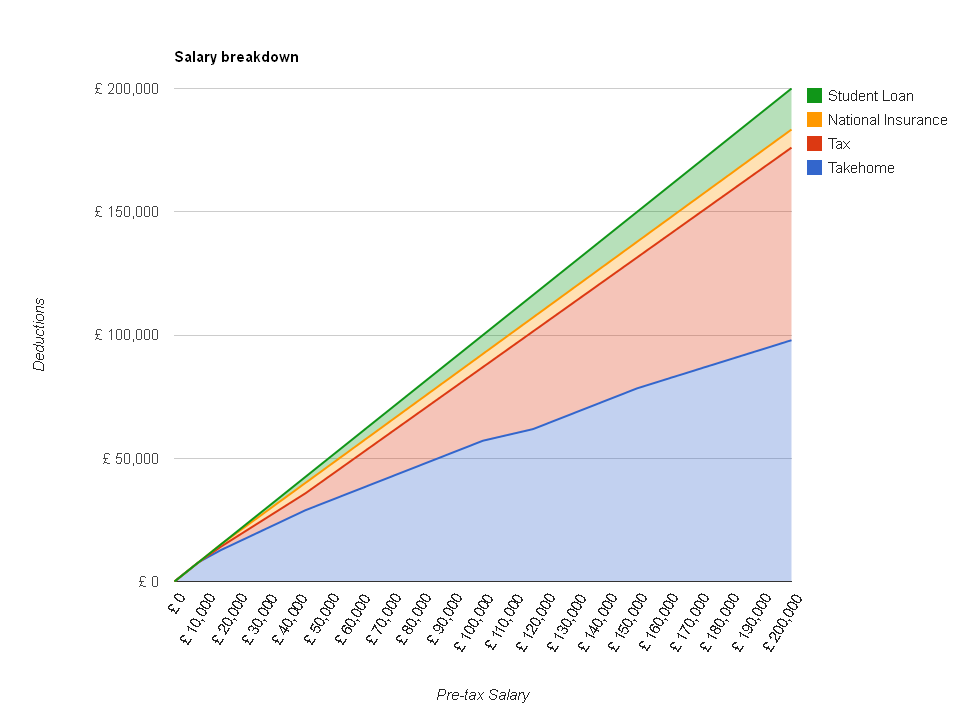
Take home is in blue – the red section on top is the tax you pay, and the yellow section on top of that is National Insurance. For those of you paying off your student loan, here is a version with those deductions on top, in green:
So you can see that as your salary goes up, your take-home pay (the blue line) always increases… but the higher your salary is, the slower your take-home pay increases with each pay rise, as more of it is going to the government.
April 2012 Update
The Salary Calculator has been updated with the latest tax information which takes effect from 6th April 2012.
This year, the standard personal allowance (the amount you are allowed to earn each year tax-free) has been increased from £7,475 to £8,105 which will mean that most of us will pay less tax. However, for higher earners, the threshold of taxable income for the 40% tax rate has been lowered from £35,000 to £34,370 – which will reduce the improvement from the increased personal allowance (although you should still be better off!). The National Insurance thresholds have also increased slightly, which all goes towards helping you bring more money home each month.
For those paying into pension schemes through their employer there is a change which may affect the amount of National Insurance you pay. Firstly, the NI rebate on “contracted-out” salary related schemes has reduced from 1.6% to 1.4% – which will mean you pay a little more National Insurance than in 2011. However, those paying into a money-purchase pension scheme will find that from April 2012 this is no longer considered “contracted-out”, so you will get no rebate at all. You can see what a difference this will make by un-ticking the “Contracted out” option on The Salary Calculator. More information is available in this goverment document explaining the change [PDF].
Head over to The Salary Calculator to see what a difference this will make to your pay packet next month – there’s even a comparison utility which shows a breakdown of the difference between 2011 and 2012.
You can read more about the April 2012 tax and NI rates on The Salary Calculator’s about page, or these useful pages from HMRC:
US tax can be complicated for same-sex couples
I was in the USA recently and was interested to see an article in the newspaper USA Today reporting that same-sex couples sometimes face extra difficulties when it comes to paying their taxes. In the US, although there is an equivalent to PAYE (where your employer deducts your tax for you), almost all taxpayers complete a tax return detailing their income, allowable deductions, and the tax they should pay. This might be more or less than what your employer deducted, so you may have to pay the difference or request a refund.
The problem for same-sex couples occurs because of two details of the American tax / legal system. Firstly, married couples can file a joint tax return, rather than filing two separate returns. Filing a return can be a laborious process, and sometimes it is necessary to pay a tax consultant to complete it for you, so filing only one can save time and money. Sometimes, filing a joint return actually leads to less tax being owed, an obvious benefit. Secondly, same-sex marriage is not recognised by the federal government (i.e. the country) but is recognised by some states (e.g. Massachusetts). What this all adds up to is same-sex couples having to file different tax returns at the state and federal levels – a joint return for their state (if it allows them to submit joint returns) and separate returns for the federal government. This can cost couples more in tax consultant fees (as there are more forms to submit) and can cost them more in tax as they miss out on the tax benefits of being a married couple.
At the moment it doesn’t appear that this problem is going to go away – not soon, in any case. You can learn more about US Federal Income Tax on the US Salary Calculator.
Why under employment bumps up insurance costs
[Guest Post]
Unemployment in the UK has edged closer to the three million mark, and is at its highest level since 1996. As well as not having a regular source of income, unemployed drivers are more likely to be hit by higher payments for car insurance. Motorists who are out work are being advised to shop around for better deals on websites such as moneysupermarket.
An investigation carried out by the BBC revealed that car owners without a job are, on average, paying around 30% more for their insurance than motorists with full-time jobs, while their premiums are potentially 63% higher. There are a few reasons why unemployed drivers are seen as risky by some insurers.
Peter Harrison, an expert on motor insurance from MoneySupermarket explained why: “This is partly because unemployed people are more likely to use their cars during the day and to drive up and down unfamiliar routes to a job interview. Also, some insurers perceive a drop in financial security as a result of losing a job means someone in that situation is more likely to make a claim, hence the rise in the price of premiums”.
When out of work, your car is vital in helping you find a new job, but the impact of losing income means you might struggle to keep up with payments on credit cards and mortgages, which could hit your credit rating. A poor credit rating could also impact upon the price of car insurance. This is why it pays to look for the best deal possible.
With the help of a price comparison site like MoneySupermarket, you can find a car insurance deal which can save you much-needed cash, but there are other ways to help you keep the cost down at a time when you need to tighten your belt. Getting a new quote could save money, as it could go down every year (£2.4bn is wasted by motorists by accepting renewal quotes). Adding someone with more driving experience to your policy could also drive the cost down.
Reducing your mileage could prove helpful. As well as saving on fuel costs, your insurer could take notice and slash the cost of your policy. Keeping in touch with the insurer about your current circumstances is also a good way to save money. Telling them about losing your job as soon as possible is important, as failing to do so could invalidate your insurance.
Categories
Tags
-
50% tax
2022
April 2010
April 2011
April 2012
budget
coronavirus
cost of living crisis
covid-19
debt
dollar
economics
Economy
election
Employed and Self Employed
Foreign Currency
foreign exchange rates
HMRC
holiday
holiday money
house prices
houses
income tax
interest rates
Jobs
Loans
Mortgages
national insurance
Pay As You Earn
pension
Pensions
personal allowance
pound
recession
recovery
savings
Self Assessment
self employed
self employment
student loans
tax rates
The Salary Calculator
unemployment
us
VAT
Sponsored Links
Archive
- November 2023
- September 2023
- August 2023
- July 2023
- June 2023
- May 2023
- April 2023
- March 2023
- February 2023
- January 2023
- December 2022
- November 2022
- October 2022
- September 2022
- August 2022
- July 2022
- June 2022
- May 2022
- April 2022
- March 2022
- February 2022
- January 2022
- December 2021
- November 2021
- October 2021
- September 2021
- August 2021
- July 2021
- June 2021
- May 2021
- April 2021
- February 2021
- January 2021
- December 2020
- November 2020
- October 2020
- September 2020
- August 2020
- July 2020
- June 2020
- May 2020
- April 2020
- March 2020
- February 2020
- November 2019
- September 2019
- April 2019
- March 2019
- December 2018
- April 2018
- March 2018
- January 2018
- May 2017
- March 2017
- February 2017
- September 2016
- June 2016
- March 2016
- February 2016
- January 2016
- June 2015
- April 2015
- March 2015
- February 2015
- January 2015
- November 2014
- October 2014
- July 2014
- June 2014
- May 2014
- March 2014
- February 2014
- January 2014
- November 2013
- October 2013
- August 2013
- July 2013
- June 2013
- May 2013
- April 2013
- March 2013
- February 2013
- January 2013
- December 2012
- November 2012
- October 2012
- September 2012
- August 2012
- July 2012
- June 2012
- May 2012
- April 2012
- March 2012
- February 2012
- January 2012
- December 2011
- October 2011
- May 2011
- April 2011
- March 2011
- January 2011
- December 2010
- August 2010
- July 2010
- June 2010
- May 2010
- April 2010
- March 2010
- February 2010
- January 2010
- December 2009
- November 2009
- October 2009
- September 2009
- August 2009
- July 2009
- June 2009


