Visualisation of salary deductions
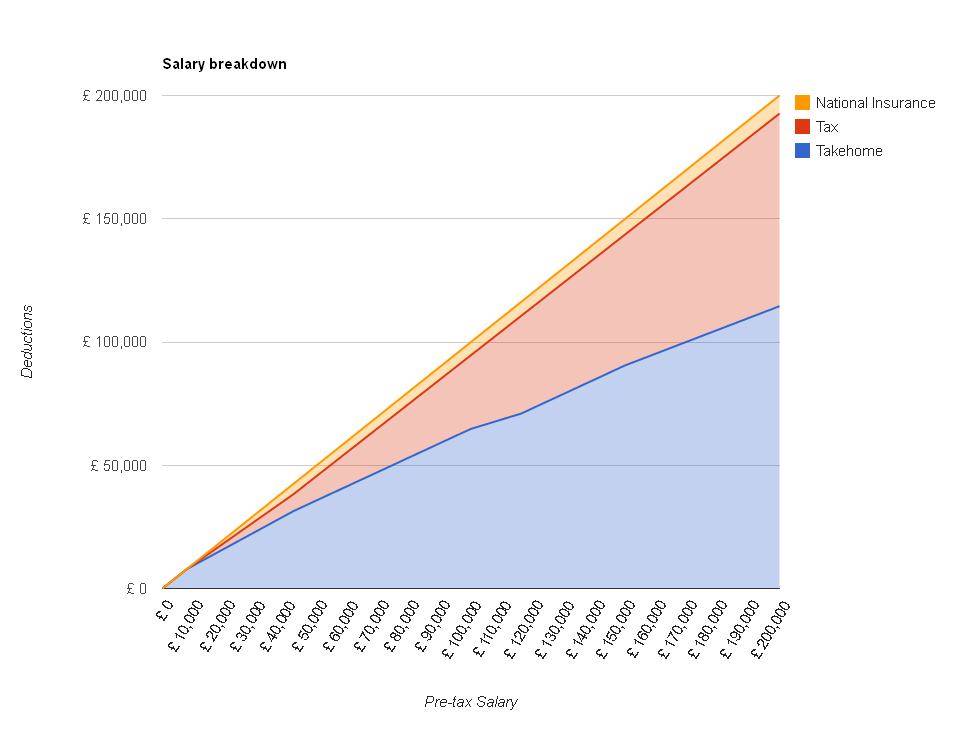
Following the update of The Salary Calculator to April 2012 tax rates, I thought it might be interesting to see how the proportion of your salary eaten up by income tax and National Insurance changes as you earn more money. If you earn less than £8,105 you pay no tax and less than £7,605 you pay no National Insurance. But those earning more than £150,000 per year will be losing nearly half their income to the tax man. I created the following chart showing how your take-home pay increases as your salary increases from £0 to £200,000:
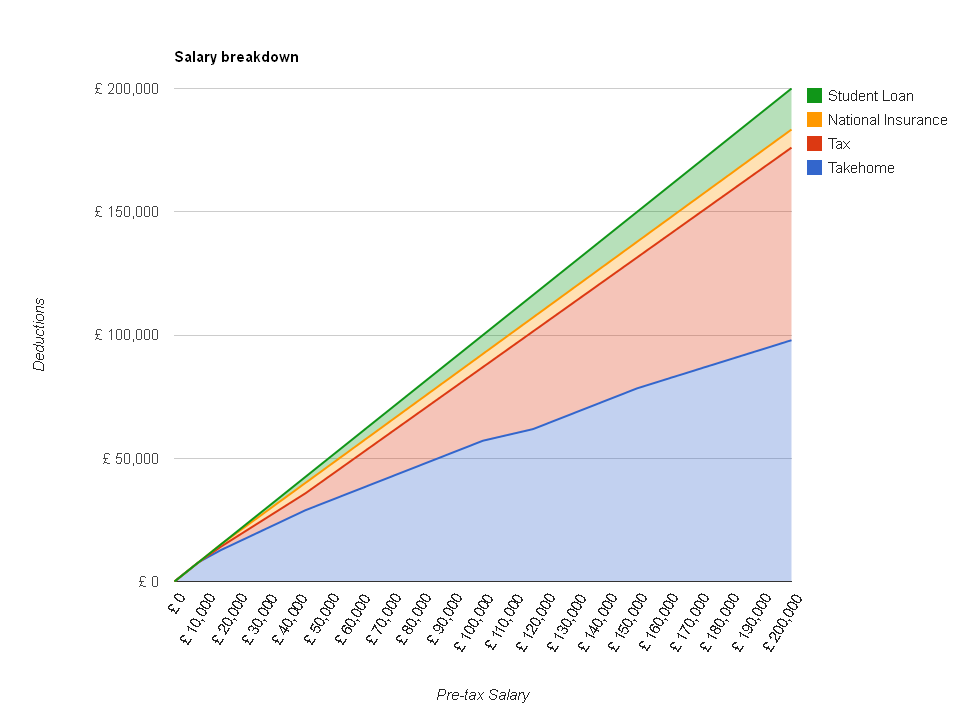
Take home is in blue – the red section on top is the tax you pay, and the yellow section on top of that is National Insurance. For those of you paying off your student loan, here is a version with those deductions on top, in green:
So you can see that as your salary goes up, your take-home pay (the blue line) always increases… but the higher your salary is, the slower your take-home pay increases with each pay rise, as more of it is going to the government.
None of the content on this website, including blog posts, comments, or responses to user comments, is offered as financial advice. Figures used are for illustrative purposes only.
No comments yet.
Leave a comment
Categories
Tags
-
50% tax
2022
April 2010
April 2011
April 2012
budget
coronavirus
cost of living
cost of living crisis
covid-19
debt
dollar
economics
Economy
election
Employed and Self Employed
Foreign Currency
foreign exchange rates
HMRC
holiday
holiday money
house prices
houses
income tax
interest rates
Jobs
Loans
Mortgages
national insurance
Pay As You Earn
pension
Pensions
personal allowance
pound
recession
recovery
savings
Self Assessment
self employed
self employment
student loans
tax rates
The Salary Calculator
unemployment
VAT
Sponsored Links
Archive
- June 2025
- May 2025
- April 2025
- March 2025
- November 2023
- September 2023
- August 2023
- July 2023
- June 2023
- May 2023
- April 2023
- March 2023
- February 2023
- January 2023
- December 2022
- November 2022
- October 2022
- September 2022
- August 2022
- July 2022
- June 2022
- May 2022
- April 2022
- March 2022
- February 2022
- January 2022
- December 2021
- November 2021
- October 2021
- September 2021
- August 2021
- July 2021
- June 2021
- May 2021
- April 2021
- February 2021
- January 2021
- December 2020
- November 2020
- October 2020
- September 2020
- August 2020
- July 2020
- June 2020
- May 2020
- April 2020
- March 2020
- February 2020
- November 2019
- September 2019
- April 2019
- March 2019
- December 2018
- April 2018
- March 2018
- January 2018
- May 2017
- March 2017
- February 2017
- September 2016
- June 2016
- March 2016
- February 2016
- January 2016
- June 2015
- April 2015
- March 2015
- February 2015
- January 2015
- November 2014
- October 2014
- July 2014
- June 2014
- May 2014
- March 2014
- February 2014
- January 2014
- November 2013
- October 2013
- August 2013
- July 2013
- June 2013
- May 2013
- April 2013
- March 2013
- February 2013
- January 2013
- December 2012
- November 2012
- October 2012
- September 2012
- August 2012
- July 2012
- June 2012
- May 2012
- April 2012
- March 2012
- February 2012
- January 2012
- December 2011
- October 2011
- May 2011
- April 2011
- March 2011
- January 2011
- December 2010
- August 2010
- July 2010
- June 2010
- May 2010
- April 2010
- March 2010
- February 2010
- January 2010
- December 2009
- November 2009
- October 2009
- September 2009
- August 2009
- July 2009
- June 2009

